A central view
Monitor multiple servers through a single fleet connection, with each machine’s metrics kept together in the dashboard.
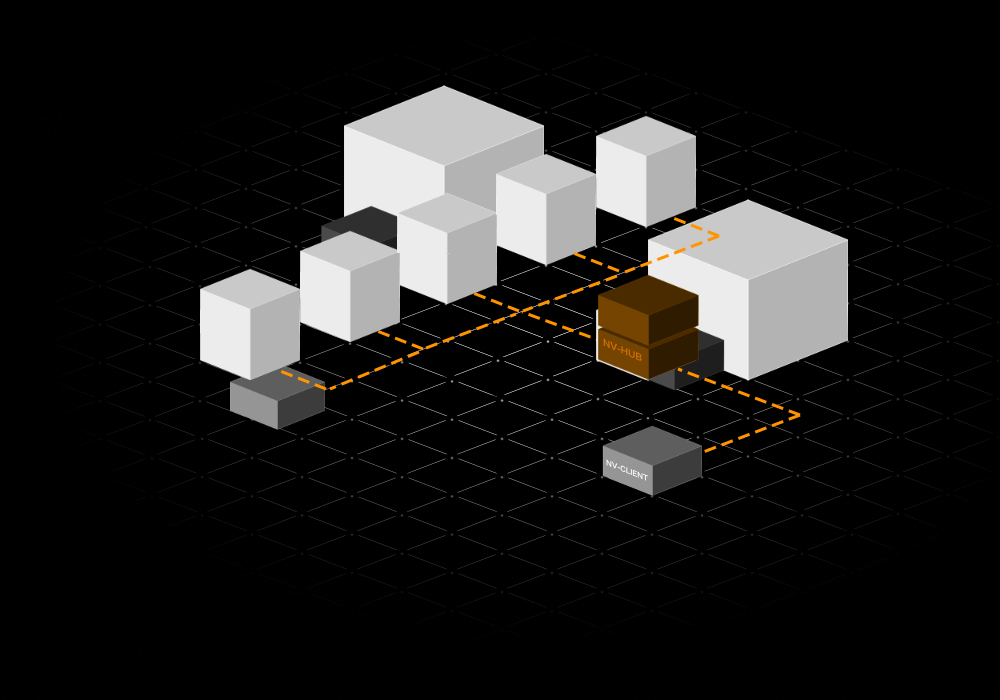
Connect to nodavex fleet for a central view of multiple servers at the same time. Fleet brings server monitoring and control together, so you can oversee your infrastructure through one connection from your device.
Compare disk usage, CPU and memory consumption, network traffic and unread notification counts across your servers. The expanded dashboard keeps each server’s metrics together, helping you spot differences in resource usage and decide where to focus your attention.
Use the notifications view to review server events with descriptions, timestamps and severity levels. Group and sort updates to make routine activity and urgent issues easier to navigate as your fleet grows.
Monitor multiple servers through a single fleet connection, with each machine’s metrics kept together in the dashboard.
Review disk space, CPU and memory usage across servers to identify machines that need attention.
See upload and download rates for each server and compare traffic across your infrastructure.
Review notifications with descriptions, timestamps and severity levels. Group and sort events to organise your view.
Explore the app’s features for a closer look at fleet monitoring and notifications.